FREE! Click here to Join FunTrivia. Thousands of games, quizzes, and lots more!
Quiz about AP Statistics Study Guide

AP Statistics Study Guide Trivia Quiz


Passing an Advanced Placement math test earns you college credit at most U.S. universities. How well would you do on a sample AP Statistics study guide test? Warning: statistics problems can be wordy!

A multiple-choice quiz by GBfan. Estimated time: 5 mins.
  1. Home
  2. »
  3. Quizzes
  4. »
  5. Science Trivia
  6. »
  7. Math
  8. »
  9. Statistics and Probability

Author
GBfan
Time
5 mins
Type
Multiple Choice
Quiz #
382,586
Updated
Dec 03 21
# Qns
10
Difficulty
Average
Avg Score
6 / 10
Plays
194
- -
Question 1 of 10
1. The number of points scored in an NBA season for a team has the following statistics: Games played is 82, mean = 99.6, mode = 104, and median = 102. How would you describe a graph of this data? Hint


Question 2 of 10
2. In a five number summary of a set of data, the second number in the summary can be described as all of the following BUT which wrong answer? Hint


Question 3 of 10
3. When graphing a scatterplot of data points involving two variables, what do the letters LSRL stand for? Hint


Question 4 of 10
4. If you're randomly calling students of a university to get the students' opinion on an increase on tuition costs, which students would you miss if you were guilty of undercoverage? Hint


Question 5 of 10
5. The following distribution of blood types in Brazil: O (45%), A (42%), B (10%), and AB (3%). What is the probability (within 0.1%) of choosing two random Brazilian blood donors and both having type O blood? Hint


Question 6 of 10
6. If something involves a binomial distribution, it must be able to meet four conditions. One is a fixed number of distributions. Second condition is a fixed probability of success for each trial. The third requirement is each observation falls into just one of two categories (success or fail). The fourth condition is that each observation is what? Hint


Question 7 of 10
7. Let's say the average teenager watches 2.5 hours of TV a day. You believe this number is much too low and want to do a hypothesis test to see if that claim can be supported. What would be the alternative hypothesis for the population mean of daily teenager TV hours be here? Hint


Question 8 of 10
8. We want to compare if dogs run faster in the day or at night. So you run a Matched Pairs t Test where each randomly chosen dog runs the same obstacle course in the day and at night and we can compare their time to complete the course. We flip a coin to determine if their first trial is run at night or during the day. Why? Hint


Question 9 of 10
9. Given a two-way table with four rows and three columns, which formula is used to compute the number of Degrees of Freedom (DF) to conduct a Chi-Square Test of Association/Independence? Hint


Question 10 of 10
10. A given regression equation of 2006 adults in a chosen city is: Predicted IQ = 95 + 6(Years of College Attended). If someone attended four years of college and has an IQ of 117, what is their residual value? Hint


(Optional) Create a Free FunTrivia ID to save the points you are about to earn:

arrow Select a User ID:
arrow Choose a Password:
arrow Your Email:


Most Recent Scores
Nov 17 2024 : batowers: 6/10
Oct 08 2024 : bernie73: 1/10

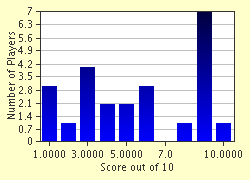
Score Distribution

quiz
Quiz Answer Key and Fun Facts
1. The number of points scored in an NBA season for a team has the following statistics: Games played is 82, mean = 99.6, mode = 104, and median = 102. How would you describe a graph of this data?

Answer: Skewed Left

If the mean equals the median, the graph would be a symmetrical distribution. But we know the mean follows the tail. In this scenario, the mean is lower than the median so this graph would be skewed left.
2. In a five number summary of a set of data, the second number in the summary can be described as all of the following BUT which wrong answer?

Answer: Median

A five number summary consists of: 1)lowest value in the set, 2)Q1 or the 25th percentile, 3)Q2 or the median, 4)Q3 or the 75th percentile, and 5)the largest value in the set.
3. When graphing a scatterplot of data points involving two variables, what do the letters LSRL stand for?

Answer: least squares regression line

The least squares regression line helps identify if the data follows a linear pattern or not. From the LSRL we can compute the residual value using the formula: Residual = Observed value - Predicted LSRL value.
4. If you're randomly calling students of a university to get the students' opinion on an increase on tuition costs, which students would you miss if you were guilty of undercoverage?

Answer: Those without phones

Non-response refers to individuals who chose not to cooperate (hung up on you or refused to answer any questions). This survey was attempting to get the students' opinions so the answers given by the professors would not be applicable here. Undercoverage refers to individuals missed by your survey method. Students without a phone or with unlisted numbers in the college record could not reached by the survey method chosen.
5. The following distribution of blood types in Brazil: O (45%), A (42%), B (10%), and AB (3%). What is the probability (within 0.1%) of choosing two random Brazilian blood donors and both having type O blood?

Answer: 20.3%

When looking for multiple probabilities, you need to consider whether these are independent or dependent events. Since the population of Brazil is so large, this scenario essentially involves independent probability since choosing Person #1 does not significantly affect the second choice. P(A and B) = P(A) times P(B) so P(Type O and Type O) = .45 x .45 = .2025.
6. If something involves a binomial distribution, it must be able to meet four conditions. One is a fixed number of distributions. Second condition is a fixed probability of success for each trial. The third requirement is each observation falls into just one of two categories (success or fail). The fourth condition is that each observation is what?

Answer: Independent

An independent observation ensures that the result of the first event has no effect on the outcome on any future observations. If events conflict or affect each other, the distribution would involve dependent probability rules.
7. Let's say the average teenager watches 2.5 hours of TV a day. You believe this number is much too low and want to do a hypothesis test to see if that claim can be supported. What would be the alternative hypothesis for the population mean of daily teenager TV hours be here?

Answer: Teenage TV hours > 2.5 hrs

The null hypothesis in this scenario is "Teenage TV Hours is less than or equal to 2.5 hours". We begin with a statement that matches the given claim. We believe that parameter given is too low so we analyze our data to see whether our sample's mean and standard deviation support or refute the null hypothesis regarding the claim of 2.5 mean TV hours for teenagers.
8. We want to compare if dogs run faster in the day or at night. So you run a Matched Pairs t Test where each randomly chosen dog runs the same obstacle course in the day and at night and we can compare their time to complete the course. We flip a coin to determine if their first trial is run at night or during the day. Why?

Answer: Familiarity with the course may lower future trial times.

The goal of a Matched Pairs t Test is to find the difference between two data sets given similar treatments. By randomizing which course is run first we can eliminate the advantage of knowing which obstacles will be part of the race. Remember if you run the course in a faster time, your registered time would be a lower number.
9. Given a two-way table with four rows and three columns, which formula is used to compute the number of Degrees of Freedom (DF) to conduct a Chi-Square Test of Association/Independence?

Answer: (# of Rows -1) x (# of Columns -1)

A Chi-Square Test of Association/Independence determines if there is a mathematically significant relationship between two categorical variables in a chosen population. An example would be do men and women both purchase the same brand of soft drinks at a restaurant? The formula to determine Degrees of Freedom is (# of Rows - 1) times (# of Columns - 1). Given a four row and three column table, we would multiple (4-1)x(3-1) to get 6 Degrees of Freedom.

The name Chi-Square is derived from the Greek letter, Chi, a symbol that looks like our English letter X.
10. A given regression equation of 2006 adults in a chosen city is: Predicted IQ = 95 + 6(Years of College Attended). If someone attended four years of college and has an IQ of 117, what is their residual value?

Answer: -2

The formula for residuals is observed value minus the predicted value. In this scenario the observed IQ is 117. Their predicted IQ would be 95 + 4(6) which equals 119 if you're using the correct order of operations. So 117-119 = -2 for your residual score. This means our predicted value is two IQ points higher than it actually was.
Source: Author GBfan

This quiz was reviewed by FunTrivia editor WesleyCrusher before going online.
Any errors found in FunTrivia content are routinely corrected through our feedback system.
11/23/2024, Copyright 2024 FunTrivia, Inc. - Report an Error / Contact Us