FREE! Click here to Join FunTrivia. Thousands of games, quizzes, and lots more!
Quiz about The HertzsprungRussell Diagram

The Hertzsprung-Russell Diagram Quiz


The Hertzsprung-Russell diagram is of interest to astronomers studying stellar evolution. I hope it is also of interest to you.

A multiple-choice quiz by looney_tunes. Estimated time: 4 mins.
  1. Home
  2. »
  3. Quizzes
  4. »
  5. Science Trivia
  6. »
  7. Astronomy

Author
looney_tunes
Time
4 mins
Type
Multiple Choice
Quiz #
362,819
Updated
Dec 03 21
# Qns
10
Difficulty
Average
Avg Score
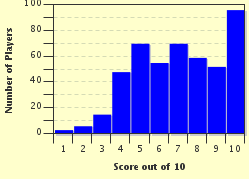
7 / 10
Plays
2281
Awards
Top 20% Quiz
Last 3 plays: Coachpete1 (10/10), Guest 107 (9/10), patrickk (9/10).
- -
Question 1 of 10
1. When did Ejnar Hertzsprung and Henry Russell develop the first Hertzsprung-Russell diagram? Hint


Question 2 of 10
2. What quantities were plotted on the vertical and horizontal axes of the first HR Diagram? Hint


Question 3 of 10
3. As well as observational HR diagrams, stellar physicists have found it useful to construct theoretical HR diagrams. What is the main difference between these two types of HR diagrams? Hint


Question 4 of 10
4. One of the most obvious features of the HR diagram is called the main sequence. Where does it appear in the diagram? Hint


Question 5 of 10
5. In the top right corner of the HR diagram is a region called the horizontal branch. What is the main fuel consumed in the fusion reactions occurring in the cores of stars in this region? Hint


Question 6 of 10
6. What (somewhat unimaginative) name is given to the empty area of the HR diagram to be seen between the top of the main sequence and the horizontal branch? Hint


Question 7 of 10
7. What kind of stars are found in the instability strip of the HR Diagram? Hint


Question 8 of 10
8. At the bottom left of the HR diagram is a nearly-horizontal band of stars, similar in brightness despite their varying temperatures. What kind of stars are primarily found in this region of the diagram? Hint


Question 9 of 10
9. When the HR diagram was first published, it stimulated others to use it as a basis for describing stellar evolution. Who published 'The Internal Constitution of the Stars' in 1926, attempting to provide an evolutionary mechanism to explain the HR diagram? Hint


Question 10 of 10
10. Where on the HR diagram will you find our sun? Hint


(Optional) Create a Free FunTrivia ID to save the points you are about to earn:

arrow Select a User ID:
arrow Choose a Password:
arrow Your Email:


Most Recent Scores
Nov 08 2024 : Coachpete1: 10/10
Oct 27 2024 : Guest 107: 9/10
Sep 27 2024 : patrickk: 9/10

Score Distribution

quiz
Quiz Answer Key and Fun Facts
1. When did Ejnar Hertzsprung and Henry Russell develop the first Hertzsprung-Russell diagram?

Answer: 1910-1913

In 1910 Hertzsprung noticed an interesting pattern in the Henry Draper Catalog of stars compiled in the late 19th century at Harvard University. He noted that some stars had relatively less brightness than other stars of the same spectral type, and started to construct a graph that analysed the patterns.

It became known as the Hertzsprung-Russell diagram (as it was developed in conjunction with Henry Russell), or HR diagram for short.
2. What quantities were plotted on the vertical and horizontal axes of the first HR Diagram?

Answer: Absolute visual magnitude vs spectral type

The vertical axis was used to plot the star's luminosity, or brightness, which is called its magnitude. The apparent visual magnitude describes how bright the star appears, while the absolute visual magnitude includes a correction for distance, so all stars are assigned a magnitude based on how bright they would appear to an observer 10 parsecs away. The brighter the star, the higher it will appear along the vertical axis.

The horizontal axis grouped stars according to their spectral type, which indicates a temperature range in which the star's energy emission falls. One of the problems with this original diagram, powerful as it was, was the fact that this is a non-continuous classification scheme. During the 20th century, this axis was changed to be a color index, allowing the use of numerical values along the horizontal axis. In the HR diagram, hotter stars appear on the left side, and cooler stars on the right.
3. As well as observational HR diagrams, stellar physicists have found it useful to construct theoretical HR diagrams. What is the main difference between these two types of HR diagrams?

Answer: The theoretical diagram uses effective surface temperature instead of color

While temperature and color are related, the transformation from color to surface temperature is not a straightforward conversion with a constant conversion factor. It is affected by the actual physical makeup of the star, its rotation, the presence of circumstellar dust and other factors that need to be taken into account. Unlike most graphs involving temperatures, theoretical HR diagrams have higher temperatures near the point where the vertical and horizontal axes meet, with values decreasing to the right.

This allows the theoretical HR diagram to assume roughly the same shape as the observational HR diagram.
4. One of the most obvious features of the HR diagram is called the main sequence. Where does it appear in the diagram?

Answer: Running diagonally from the upper left corner to the lower right corner

The main sequence shows that, for the majority of stars, brighter stars are hotter than less bright stars. Not surprising, perhaps, but the existence of the other regions of the diagram needs to be explained. When the HR diagram was first published, astrophysicists did not know what was going on inside stars to produce light. Now we know that stars in the main sequence are (primarily) fusing hydrogen to produce helium.
5. In the top right corner of the HR diagram is a region called the horizontal branch. What is the main fuel consumed in the fusion reactions occurring in the cores of stars in this region?

Answer: Helium

The horizontal branch is where subgiants, giants and supergiants are found. These stars have accumulated significant amounts of helium, and are now in the process of consuming helium in their cores, while hydrogen fusion still proceeds in their outer shells. Stars in this region are now known to be older than stars in the main sequence, where hydrogen is still the primary fuel.
6. What (somewhat unimaginative) name is given to the empty area of the HR diagram to be seen between the top of the main sequence and the horizontal branch?

Answer: Hertzsprung gap

The Hertzsprung gap separates main sequence stars and giants. It is quite obvious, and raised the theoretical question as to why it occurred. On the original diagram, it appeared between the A5 and G0 spectral types on the horizontal axis, and between +1 and -3 absolute magnitudes on the vertical axis.

The stars in that region are nearing the end of the hydrogen burning phase of their life cycle, and have not yet entered the helium burning phase. They move through this stage very quickly (in stellar evolutionary terms), so very few stars are found there.
7. What kind of stars are found in the instability strip of the HR Diagram?

Answer: Pulsating variable stars

The instability strip goes in a nearly vertical line between the horizontal branch (where RR Lyrae variables are found) and the main branch (where Delta Scuti variables are located). Along its path are also found Cepheid variables, W Virginis variables and SX Phoenicis variables. All of these types of star show pulsing emissions (hence the term "variable" used to describe them).

They are distinguished on the basis of the reasons postulated for their variable emissions.
8. At the bottom left of the HR diagram is a nearly-horizontal band of stars, similar in brightness despite their varying temperatures. What kind of stars are primarily found in this region of the diagram?

Answer: White dwarfs

A white dwarf is considered a stellar remnant. When a main sequence star runs out of hydrogen, it starts using helium, and turns into a giant star. If the red giant does not have sufficient mass to proceed on to fusing carbon, it eventually turns into a white dwarf, in which fusion no longer occurs. Over time it loses energy from heat radiation, cooling from white to yellow to red, and (theoretically) eventually to black.
9. When the HR diagram was first published, it stimulated others to use it as a basis for describing stellar evolution. Who published 'The Internal Constitution of the Stars' in 1926, attempting to provide an evolutionary mechanism to explain the HR diagram?

Answer: Arthur Eddington

Despite the fact that virtually nothing was known of thermonuclear reactions, Eddington managed to provide a plausible cycle from main sequence to the horizontal branch and then to white dwarfs by considering the radiational transfer of energy inside stars.

He showed that the previously-accepted Kelvin-Helmholtz mechanism was inadequate, but did not come up with a definitive explanation of the mechanism by which stars produce energy. It was not until the 1930s that Hans Bethe showed that nuclear fusion was the source of stellar energy.
10. Where on the HR diagram will you find our sun?

Answer: Main sequence - near the middle

The sun is assigned a luminosity value of 1 and a temperature of 5780K on a theoretical HR diagram. On an observational HR diagram it has absolute magnitude 4.8 and its spectral type G2V is associated with a color index of 0.66. This places it slightly to the left of the middle of the observational HR diagram, for which the vertical axis runs from -10 to +20, and the horizontal axis from -0.3 to 1.8.
Source: Author looney_tunes

This quiz was reviewed by FunTrivia editor CellarDoor before going online.
Any errors found in FunTrivia content are routinely corrected through our feedback system.
Related Quizzes
This quiz is part of series The Joy of Science:

A collection of quizzes exploring some of the fascinating aspects of science, aimed at players with a high school science background. Or those who are just curious about their world.

  1. Heavy Metal Lover Easier
  2. The Physical Revue Featuring Tom Lehrer Average
  3. A Chemical Tourist Easier
  4. A Category of One's Own Average
  5. Nuclear Fission For Kids! Average
  6. Molecules of Life Average
  7. The Hertzsprung-Russell Diagram Average
  8. Signs for Designs Tough
  9. Billions and Billions of Stars Easier
  10. The Eyes Have It Average
  11. The Power is Yours Average
  12. Mohs Scale Easier

11/21/2024, Copyright 2024 FunTrivia, Inc. - Report an Error / Contact Us