FREE! Click here to Join FunTrivia. Thousands of games, quizzes, and lots more!
Quiz about UK General Elections 2010 and 2015

UK General Elections: 2010 and 2015 Quiz


This quiz takes a look at the results of the UK General Elections held in 2010 and 2015 through the medium of pictures. Enjoy!

A photo quiz by jonnowales. Estimated time: 4 mins.
  1. Home
  2. »
  3. Quizzes
  4. »
  5. World Trivia
  6. »
  7. Government
  8. »
  9. U.K. Government

Author
jonnowales
Time
4 mins
Type
Photo Quiz
Quiz #
376,516
Updated
Dec 03 21
# Qns
10
Difficulty
Easy
Avg Score
8 / 10
Plays
431
Awards
Top 35% Quiz
-
Question 1 of 10
1. This map shows how each constituency of the United Kingdom voted at the 2010 General Election. Given that the Conservatives are represented by the colour blue, Labour by red, Liberal Democrats by gold and the Scottish National Party (SNP) by yellow, which party represented the largest proportion of England in terms of area immediately after the election? Hint


photo quiz
Question 2 of 10
2. The grey-coloured constituency to the northwest of London is Buckingham and this seat was won by John Bercow in 2010. The grey colour reflects the fact that John Bercow was an independent candidate but for what reason did he stand as an independent? Hint


photo quiz
Question 3 of 10
3. This electoral map from 2010 depicts all the constituencies of the United Kingdom as though they were all of the same geographical size. Which of the following political parties had the greatest success in Scotland at the 2010 UK General Election? Hint


photo quiz
Question 4 of 10
4. Given the fact that Labour is represented by red, Conservatives by blue, Liberal Democrats by yellow and Plaid Cymru by green, which of the following statements is true about the 2010 General Election results in Wales? Hint


photo quiz
Question 5 of 10
5. Which party won the most seats at the United Kingdom's 2010 General Election? Hint


photo quiz
Question 6 of 10
6. The biggest story of the 2015 UK General Election was what happened in Scotland. Given the maps provided (2015 results on the left, 2010 results on the right), which of the following fundamentally changed the political landscape of Britain? Hint


photo quiz
Question 7 of 10
7. Which part of the United Kingdom, which has historically had its own unique political landscape, didn't return a single Labour, Conservative or Liberal Democrat Member of Parliament (MP) in the 2015 General Election? Hint


photo quiz
Question 8 of 10
8. If somebody were to be seen wandering the streets of the United Kingdom, navigating the campaign trail in the run up to the 2015 General Election wearing this badge, which of the following party leaders would have directly benefitted from the person's vote? Hint


Question 9 of 10
9. Which party won the most seats at the United Kingdom's 2015 General Election? Hint


photo quiz
Question 10 of 10
10. The 2015 UK General Election was considered to be one characterised by disproportion. What political party, led by Nigel Farage, has a case for feeling rather hard done by in terms of vote share to seat share disproportion? Hint


photo quiz

(Optional) Create a Free FunTrivia ID to save the points you are about to earn:

arrow Select a User ID:
arrow Choose a Password:
arrow Your Email:


View Image Attributions for This Quiz

Most Recent Scores
Dec 08 2024 : rivenproctor: 10/10
Nov 17 2024 : postcards2go: 9/10

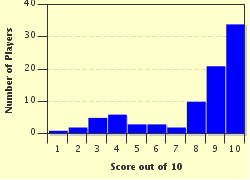
Score Distribution

quiz
Quiz Answer Key and Fun Facts
1. This map shows how each constituency of the United Kingdom voted at the 2010 General Election. Given that the Conservatives are represented by the colour blue, Labour by red, Liberal Democrats by gold and the Scottish National Party (SNP) by yellow, which party represented the largest proportion of England in terms of area immediately after the election?

Answer: Conservatives

The Conservatives have traditionally been very strong in England and even more so in the rural areas of the largest constituent nation of the United Kingdom. Given that political constituencies in the UK are based on population, though it appears a very loose connection at times, rural constituencies tend to be much larger than urban ones due to lower population density.

As a consequence of the strength of the Conservatives in rural England, the map of the UK tends to be predominantly blue whether they win an election or not. What is notable from the 2010 map is that the Conservatives continued to rebuild in Wales, though Scotland, as it so often happens to be for the modern Conservative Party, remained largely impenetrable.
2. The grey-coloured constituency to the northwest of London is Buckingham and this seat was won by John Bercow in 2010. The grey colour reflects the fact that John Bercow was an independent candidate but for what reason did he stand as an independent?

Answer: He was the incumbent Speaker of the House of Commons

It is a long-standing convention at the UK General Election that the mainstream political parties refuse to add a candidate to the ballot paper at the constituency being defended by an incumbent Speaker of the House of Commons. In 2010, John Bercow was the incumbent Speaker which resulted in the contest for Buckingham being a foregone conclusion; this was also the case in 2015. There are some who dislike this convention as there is the feeling that people who reside in the Speaker's constituency are effectively disenfranchised.

John Bercow was originally a Conservative MP but in the tradition of Speaker neutrality he gave up the Conservative whip and became independent.
3. This electoral map from 2010 depicts all the constituencies of the United Kingdom as though they were all of the same geographical size. Which of the following political parties had the greatest success in Scotland at the 2010 UK General Election?

Answer: Labour (Red)

As a result of the varying geographical size of UK constituencies, the traditional map of the country can often be misleading when it comes to determining which parties are strong in any given region. This map scales each constituency so that they are the same size; the consequence of doing this is to reduce the large splashes of blue (Conservative) and emphasise the urban success of Labour (red).

Many of the constituencies in Edinburgh and particularly Glasgow are comparatively small due to high population density; when the map is scaled it becomes clear how dominant Labour were in Scotland (the northernmost region on the map) in 2010.
4. Given the fact that Labour is represented by red, Conservatives by blue, Liberal Democrats by yellow and Plaid Cymru by green, which of the following statements is true about the 2010 General Election results in Wales?

Answer: The south Wales valleys region was dominated by Labour

The valleys of south Wales have always been a reliable source of seats for the Labour party; the map shows the splash of red that extends from Newport and Cardiff in the east, to Gower and Llanelli in the west. Plaid Cymru, who campaign for Welsh national autonomy, won three of the seats available (Carmarthen East & Dinefwr, Arfon and Dwyfor Meirionydd) and these were all rural. The Conservatives were strong in Pembrokeshire, Monmouthshire and in parts of north Wales.

At the 2015 UK General Election, the Conservatives surprisingly won in the Gower constituency for the first time since the seat was created in 1885!
5. Which party won the most seats at the United Kingdom's 2010 General Election?

Answer: Conservative (Blue)

The Conservatives won 307 seats at the 2010 General Election, whilst Labour won 258, Liberal Democrats 57 and Others picked up 28. The magic number of seats which needed to be achieved in order to form a majority government was 326 but no party reached the threshold.

This was one of the closest elections in a generation and the aftermath saw much horse-trading and deal-making. The result of all the discussions was a surprise coalition formed by the Conservatives and the Liberal Democrats. The expectation was that Labour and the Liberal Democrats would unite given that they tend to align with each other on matters of policy more frequently than the Liberal Democrats do with the Conservatives.

The Conservatives seemed to do quite well out of the coalition, but the minority partner seemed to attract all the negative publicity for some of the less popular decisions made by the government; there was a belief that the Liberal Democrats had given up on their principles simply to get into power and as such became enablers of the austerity movement that was disliked by many, including a large contingent of students, who supported the party.

In 2015, the Liberal Democrats performed extremely poorly, losing support in their traditional heartlands of Cornwall, the Scottish Highlands and university towns.
6. The biggest story of the 2015 UK General Election was what happened in Scotland. Given the maps provided (2015 results on the left, 2010 results on the right), which of the following fundamentally changed the political landscape of Britain?

Answer: Labour (red) were almost wiped out in Scotland in 2015

Labour being wiped out in Scotland at the 2015 General Election is perhaps the most incredible electoral outcome since Labour's landslide victory under Tony Blair in 1997. In 2010, Labour won 41 of the 59 Scottish seats contested; in 2015 they lost 40 of those, leaving them in control of just a single Scottish constituency, Edinburgh South.

The Liberal Democrats also got wiped out in Scotland save for the remote constituency of Orkney and Shetland. The party that benefitted from this incredible move away from the traditional parties was the Scottish National Party (SNP) who picked up 56 of the 59 seats, the map of Scotland repainted in yellow.
7. Which part of the United Kingdom, which has historically had its own unique political landscape, didn't return a single Labour, Conservative or Liberal Democrat Member of Parliament (MP) in the 2015 General Election?

Answer: Northern Ireland

Northern Ireland occupies a completely different space to Wales, England and Scotland when it comes to politics. The turbulent history and the greater influence of different denominations of Christianity means that the electorate of Northern Ireland has a unique set of concerns when it comes to voting for a political party.

As can be seen from the map provided, the colours of Northern Ireland are different to those that paint the rest of the UK. Instead of the likes of Labour, the Conservatives and the Liberal Democrats winning seats in Northern Ireland, parties such as Sinn Fein, the Democratic Unionist Party (DUP) and the Ulster Unionist Party (UUP) are more prominent.

In fact, it isn't typical for Labour, the Conservatives or the Liberal Democrats to even field a candidate in the northern reaches of Ireland.
8. If somebody were to be seen wandering the streets of the United Kingdom, navigating the campaign trail in the run up to the 2015 General Election wearing this badge, which of the following party leaders would have directly benefitted from the person's vote?

Answer: Ed Miliband

Ed Miliband led Labour into the 2015 General Election and a lot of the focus in the years leading up to the crucial national vote was on his personality more than his policy. Ed Miliband was very much the favourite of the trade unions, and partly because of this he beat his brother, David, in the party's leadership election held in 2010. Many viewed this choice as a mistake right from the get go as it is traditionally the case that the party that tends to win an election is the party that can win the support of "middle England" constituencies. Affiliation with the trade unions doesn't go down well in these constituencies and, as expected, Labour failed to penetrate this segment of the electorate in the 2015 General Election.

David Cameron was the leader of the Conservatives, the winners of the 2015 General Election, whilst Nick Clegg headed up the Liberal Democrats. Nicola Sturgeon played a major part in this election in her role as the leader of the Scottish National Party (SNP). Of the four party leaders mentioned, two of them resigned shortly after the election: Ed Miliband and Nick Clegg.
9. Which party won the most seats at the United Kingdom's 2015 General Election?

Answer: Conservatives

This particular election turned out to be a very difficult one to analyse as the results were completely different to anything that had been seen before. In Scotland, Labour were wiped out due to the rise of the SNP; the consequence of this is that Labour would have to rely on their heartlands in the north of England, the south of Wales and in large English cities remaining loyal. In addition to this, Ed Miliband and Labour would have to appeal to "middle England" constituencies in a way that Tony Blair managed in 1997, 2001 and, to a lesser extent, in 2005. In terms of electoral mathematics, Scotland was an irrelevance to the Conservatives; prior to 2015 they only had one MP representing a Scottish constituency and this remained the same after the 2015 General Election.

As mentioned, given the situation in Scotland, Labour needed to pull out all the stops in England, but this just didn't happen; the party failed to win the votes of the English middle class and small business owner segments of the UK electorate. Labour held on to their traditional support from the north east of England and the valleys of south Wales.

The other element at play was the collapse of the Liberal Democrat party, not only in the highlands and islands of Scotland but in their fortress in south west England. Cornwall has typically provided a good number of Liberal Democrat MPs but the county completely abandoned the party in 2015. All Liberal Democrat seats in Cornwall were lost and the Conservatives were there to take over in all of them; with the summation of minor surprises such as this, the Conservatives managed to claw their way to a narrow parliamentary majority. The final result in terms of seats for the main parties was:

Conservatives - 330
Labour - 232
SNP - 56
Liberal Democrats - 8
10. The 2015 UK General Election was considered to be one characterised by disproportion. What political party, led by Nigel Farage, has a case for feeling rather hard done by in terms of vote share to seat share disproportion?

Answer: UK Independence Party (UKIP)

The UK Independence Party (UKIP), led by the rather outspoken Nigel Farage, ensured that the issue of immigration and the relationship between the UK and the European Union (EU) would be brought to the fore. The party entered the 2015 General Election on a platform of success in the 2014 election of representatives to the European Parliament. They secured 24 of the 73 seats available, the most of any party; this result changed the politics in Britain for the next few years as this was the first time a party other than the Conservatives or Labour had won a UK national election in a very long time. It was the air of legitimacy that UKIP needed in their pursuit to win seats at Westminster. From the point of view of UKIP, the outcome of the 2015 UK General Election was a poor one and observers decried the supposed lack of proportionality in the first past the post (FPTP) voting system used in the UK.

Whilst Labour, the Conservatives and the SNP all benefitted from FPTP this time around, UKIP most certainly didn't. As the table shows, UKIP secured 12.60% of the national vote but that translated to just one seat out of 650 (0.15%). Calculating the difference:

% of seats - % of votes = 0.15 - 12.60 = -12.45

This value is indeed disproportionate. On the other hand, those who support the retention of FPTP, would argue that national share is irrelevant in an electoral system that has always valued the tie between a small constituency and a constituency MP. Essentially, why should it matter to somebody in a Cardiff constituency what people in Swindon constituencies think?
Source: Author jonnowales

This quiz was reviewed by FunTrivia editor stedman before going online.
Any errors found in FunTrivia content are routinely corrected through our feedback system.
12/21/2024, Copyright 2024 FunTrivia, Inc. - Report an Error / Contact Us